
Guilherme Dumit
Diretor da Sigma Geotecnologia Digital
OpAA73
Sensoriamento remoto: o jogo começou para os gestores agrícolas
Nos últimos 15 anos, o modelo de produção de cana-de-açúcar sofreu uma enorme mudança tecnológica. Parte disso provocada pela exigência legal e ambiental em reduzir (e eliminar) o sistema de produção de “cana queimada”, e outra parte, pela natural evolução de tecnologias, computadores de bordo, monitoramento em tempo real dos equipamentos, máquinas e caminhões.
O conceito de Agricultura 4.0 avançou como uma onda em todo o sistema de produção, com tecnologias que incrementaram as atividades agrícolas de conservação e preparo de solo, plantios mecanizados, tratos culturais e manejo da colheita mecanizada, identificação de pragas do solo, controle de ervas daninhas, pulverizações automatizadas, programas de melhoramentos genético de variedades e por aí vai.
De fato, vimos uma revolução na gestão e eficiência das operações mecanizadas, eficiência nas manutenções mecânicas preventivas e importantes otimizações no uso de equipamentos, máquinas, com forte reflexo positivo no budget das companhias.
Todo o sistema produtivo apresentou ganhos reais, melhor qualidade nas operações, maior segurança aos colaboradores, importantes reduções de custos operacionais, melhorias na imagem das companhias e suas relações com a sociedade e com o meio ambiente.
Comenta-se, nas empresas, que, apesar de toda essa evolução tecnológica (especialmente nas atividades mecanizadas), não foram observadas evoluções significativas em produtividades agrícolas (TCH) nos últimos anos. Esse tem sido o grande desafio dos gestores agrícolas atuais. Diante desse desafio, se tornou imprescindível avaliar as melhores tecnologias para monitorar o comportamento do canavial – patrimônio biológico cana-de-açúcar, a fim de mitigar possíveis causas dessa estagnação das produtividades.
Nesse sentido, houve, recentemente, uma grande evolução na utilização dos recursos de sensoriamento remoto para o efetivo monitoramento temporal da cana e açúcar. Satélites equipados com sensores ópticos que captam de forma temporal imagens da superfície terrestre a distância, entraram definitivamente no jogo da gestão agrícola das companhias.
Os gestores agrícolas mais tradicionais lembram como era desafiador realizar uma estimativa de cana-de-açúcar andando nos carreadores e olhando horizontalmente a “lateral da cana” e prevendo suas produtividades. Assim como era ocasional um sobrevoo de avião ou helicóptero (uma ou duas vezes ao ano) para ver o canavial de cima, seus pontos fortes e suas fragilidades. Também desafiador era definir com precisão as áreas/blocos de reforma somente com uma análise visual e horizontal do canavial. Hoje, estão à disposição dos gestores plataformas digitais que utilizam imagens de satélites semanais, que classificam os níveis de biomassa – NDVI (Índice de Vegetação por Diferença Normalizada), umidade presente na folhas NDWI (Índice de Diferença Normalizada da Água) de cada talhão, fazenda, apontando a curva de evolução ou involução do canavial e suas tendências de produção final - TCH e ATR.
Os gestores agrícolas andam em campo com seus celulares em mãos, alimentadas com imagens recentes de satélites interpretadas com a tecnologia NDVI, indicando os níveis de biomassa de cada talhão, alertas de áreas do 1º ao 3º corte com baixas produtividades, presença de ervas daninhas, falhas, áreas suspeitas com pragas de solo, fácil identificação dos blocos de colheitabilidade, fotos georreferenciadas das anomalias cuja equipe a própria plataforma distribui, além da facilidade de definir os blocos de reforma (analises de NDVI das áreas candidatas a reforma).
Essas plataformas digitais são alimentadas pelos banco de dados agrícolas, base cartográfica (mapas das fazendas georreferenciados), constantemente atualizadas, formando um conjunto histórico de dados (Big Data), conduzidos por algoritmos que apontam anomalias, alertas e desvios de comportamento do canavial – é a máquina trabalhando com os dados atuais e históricos a favor dos gestores (machine learning).
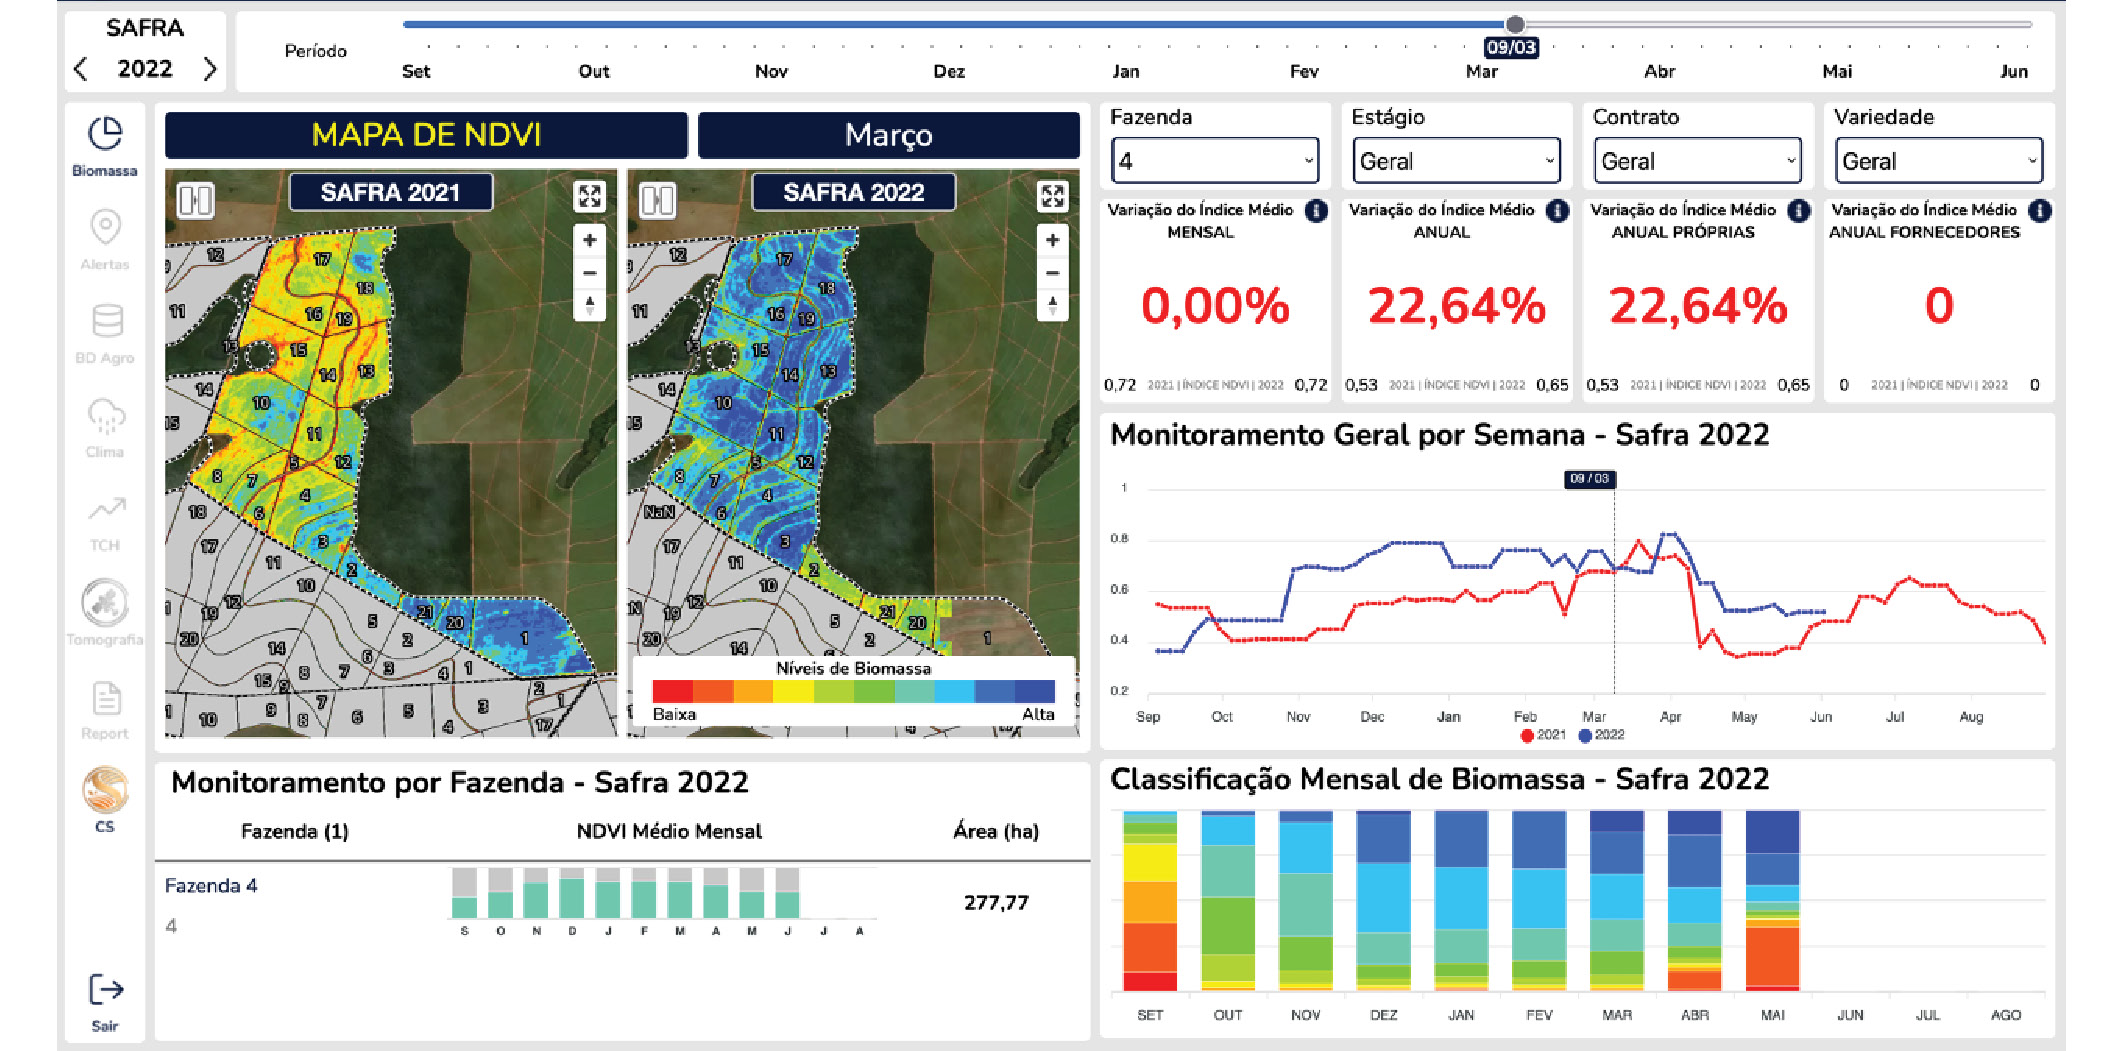
Observe, a seguir, a ilustração que exemplifica uma fazenda com seus respectivos índices de biomassa (grade de cores), alertas de presença de ervas daninhas, falhas, pontos de baixas produtividades e manchas NDVI – possível presença de pragas de solo.
De fato, essas tecnologias disponíveis modernizam o atual modelo de gestão agrícola, realiza análises temporais e permite identificar, com a devida antecedência, problemas e surpresas futuros. O monitoramento permanente dos canaviais via satélites aponta anomalias e permite ações preventivas. O canavial mostra nas imagens de satélites suas qualidades e angústias. É verdade que pior que uma má notícia é uma notícia tardia. Uma outra importante utilização de imagens de satélites, está relacionada ao uso das terras no entorno das unidades industriais. Atualmente, os níveis de concorrência regional pelo uso das terras (aumento das áreas de plantios/expansões) tornaram-se um grande desafio para os gestores.
A terra no entorno das unidades é um bem finito (não dá pra mudar a unidade industrial de lugar), e, por isso, os valores de parcerias/arrendamentos pelo uso da terra se elevam a cada ano (de forma preocupante).
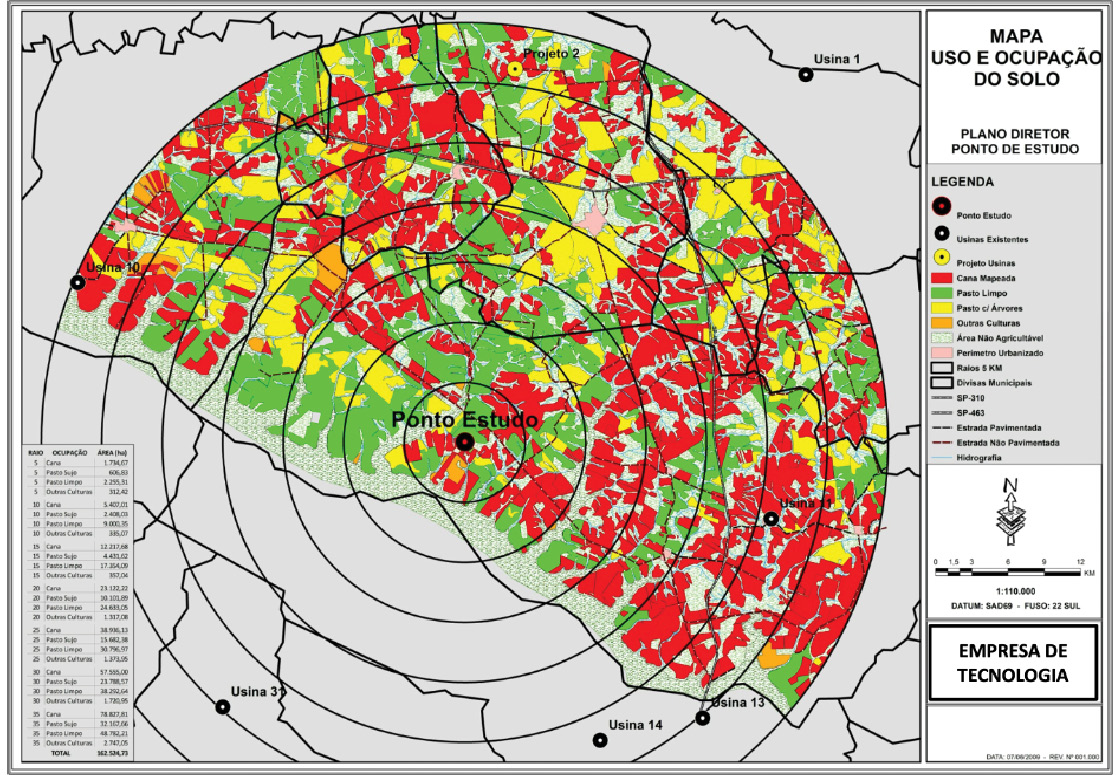
Um levantamento via satélites de uso e ocupação do solo no entorno da indústria auxilia as decisões dos gestores. Com ele, é possível identificar, com exatidão, os hectares utilizados com cana-de-açúcar, áreas com outras culturas (cítrus, eucalipto, milho, soja), áreas disponíveis em pastagens e suas respectivas distâncias até a indústria, além da declividade do terreno e relevo.
Com esse levantamento didático em mãos, os gestores agrícolas realizam uma análise estratégica e exata da disponibilidade de áreas para novos plantios/expansões de lavoura. Veja, a seguir, a figura ilustrativa de um levantamento de uso e ocupação do solo via satélites no entorno da indústria e suas respectivas utilizações agrícolas.
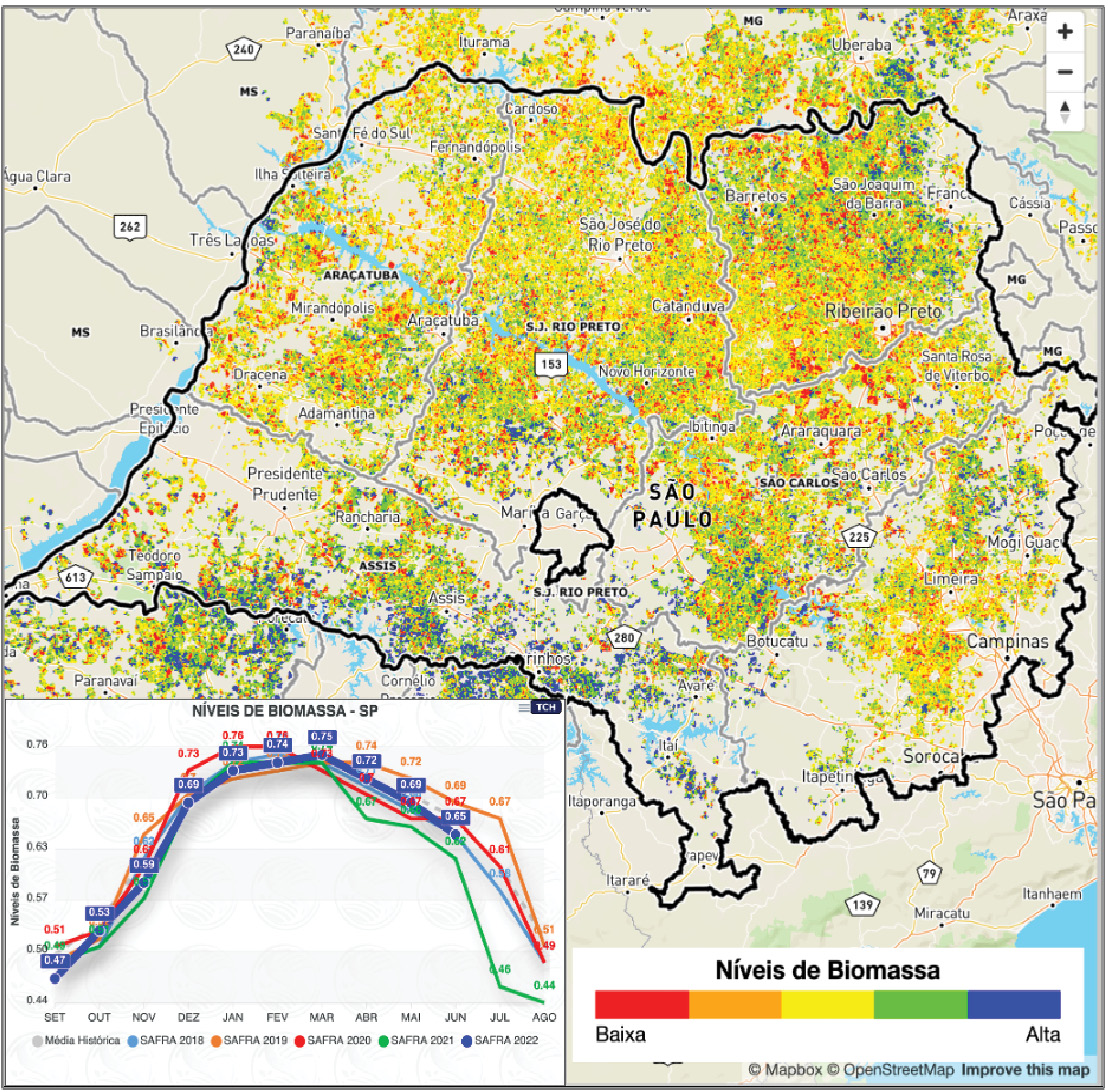
Em uma escala maior, a utilização das técnicas de sensoriamento remoto (uso de imagens de satélites) possibilita também analisar e monitorar o comportamento de todo o canavial do Centro-Sul do Brasil – 9 milhões de hectares aproximadamente. Análises mensais via satélites permitem avaliar índices de crescimento temporal da cana-de-açúcar, compará-los com períodos anteriores, analisar os impactos das secas e geadas e prever tendência de produção de matéria-prima a cada safra, para cada região e estado do Centro-Sul do Brasil. Veja, ao lado, a ilustração do Centro-Sul do Brasil avaliado via satélites – NDVI e seus respectivos índices comparativos mensais/anuais de crescimento.
Imagens de satélites interpretadas com tecnologia NDVI, registrando o comportamento histórico da cana-de-açúcar e permitindo uma melhor análise de tendências futuras.
Ao olharmos pelo retrovisor, vimos que toda essa revolução digital na agricultura aconteceu aproximadamente nos últimos 15 anos (período muito curto).
Ao olharmos para a frente, com o avanço da agricultura digital, Internet das Coisas, evolução das técnicas de sensoriamento remoto, imagens de satélites cada vez com mais revisitas e melhores resoluções espectrais, maior disponibilidade de Sensores de monitoramento, desenvolvimento de melhores algoritmos, Big Data, armazenamento de dados em nuvens, velocidade dos sinais da internet – 5G, ficamos nos perguntando: como estará nosso sistema e modelo de gestão agrícola daqui a 10 anos?
Apertem os cintos. Muita emoção e trabalho pela frente.